
How To Build A Data-Driven Culture: A Layered Access Approach
29 March 2023

In business, cultivating a data-driven culture is often cited as one of those things that we really, really want — but often nobody seems to have actionable steps to achieve. Typically, as a result, it hangs around until people are sick of hearing the phrase and the entire approach gets scrapped, only to be revisited shortly later in a sort of business micro-cycle.
Historically, there have been a few challenges in creating a data-driven culture, including a lack of engagement from the business. That’s not to say it’s the only reason, but it’s still one of the major reasons for businesses being unable to arm internal meetings and decision-making processes with all of the collected facts and figures.
Here, and in a subsequent sister-article focusing on the data functional side, I aim to provide actionable steps to businesses who simply want to use what they have in a more effective way. It’s not a silver bullet, but it should provide the baseline for a more effective interface between the technical data teams and the business.
From a business perspective, the main thing we have to consider is the degree to which we wish to expose our people to data. People come with all sorts of different ways of thinking (just ask Netflix!), some more analytical than others, and while there’s plenty of literature on the benefits of a diverse workforce, it’s often overlooked that some individuals just may not engage positively with high degrees of exposure to complex information. Similarly, there are some individuals who, despite a natural affinity to mathematics or other technical pursuits, may not be working in our data teams — and those individuals can be leveraged to add to the body of information the business holds.
Enter the concept of Layered Access.
This approach allows for a sweet spot between dedicated data analysts and the report-consuming, operational users. Providing the ‘data-hungry’ group, as we’ll call them, with data offers the most effective way of encouraging regular contact with meaningful data without an army of expensive analysts. This can really help improve communication in the data interface, which I’ve written about previously.
The key concept is that each ‘layer’ offers a slightly more technical set of information, with a higher degree of insight possible. This ranges from the very highest view, which is simply a single metric or KPI that helps indicate performance to leadership groups, all the way down to the raw data encountered by the data engineering teams.
In today’s data world, the creation of reporting models, or curated datasets as they can be known, is becoming quite common — and helps not only scale the data consumption and capabilities of an organisation, but also bridges the gap between the technical analysts and the (historically) non-technical operations teams. It’s a way to bring those groups closer together.
To summarise in a (very) simple graphic, it might look like this:
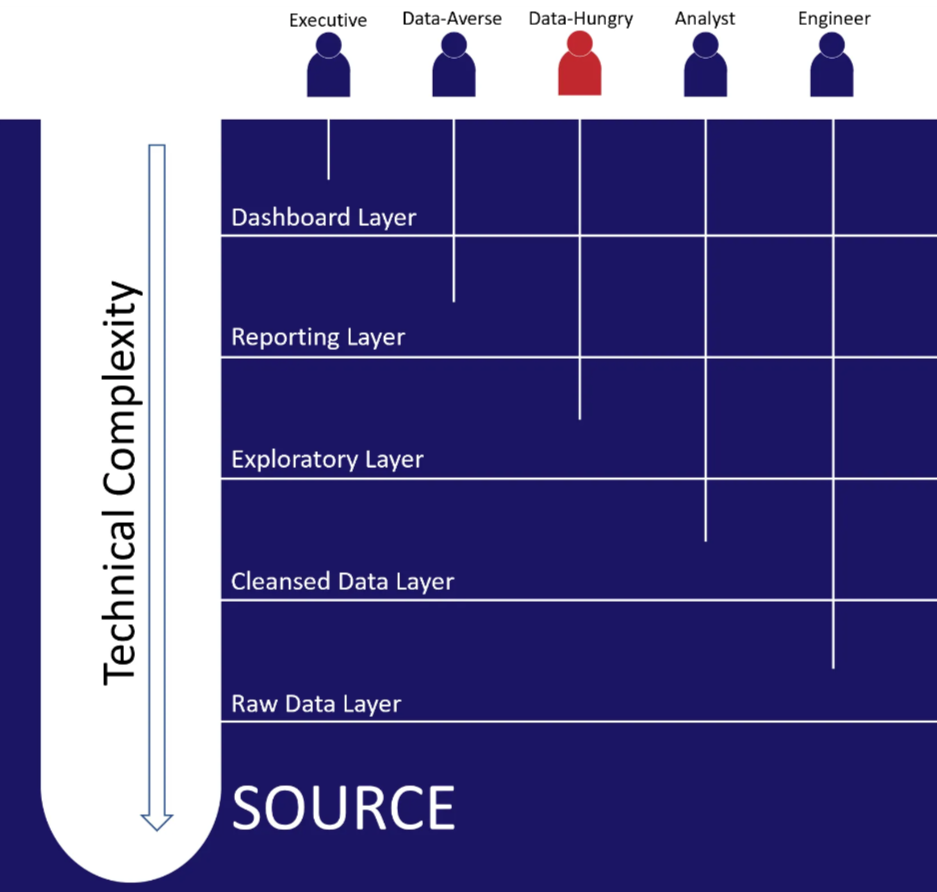
So — to fill in the detail, from the bottom up:
- Raw Data Layer — The Engineer’s Workshop This is where the rough diamonds are pulled from the ground, so to speak. There’s nothing particularly new here. The raw data sources should be the life-blood of the data engineers as they draw in the data and follow processes that organise that data into storage areas — ensuring that the data can be then used in future refinement processes. It is likely that in doing so, the engineers will also look to provide a cleansed version of the data that can be used for the earliest analysis stages.
- Cleansed Data Layer — The Analyst’s Workshop Once the data are cleaned (and perhaps modelled) to a reasonable degree, in step the analysts. This isn’t a particularly innovative or unusual step in the context of a modern data function — we’ve been doing this for years. Analysts do what analysts do. They have a pre-organised body of data, provided by data engineers, and they take that information and create reporting models and reports. In this guide, “reporting models” is an important element. Analysts should be capable of serving both the data-averse and the data-hungry workforces. Reporting models will allow the data-hungry workforce to self-serve with pre-modelled, governed information and reports will ensure that the data-averse are not left behind.
- Exploratory Layer — Data-Hungry Workforce This is the step that is often missed when trying to create a data-rich culture in organisations. The understanding and governance of self-serve. Historically, data analysts create reports, but that is no longer enough. The data-hungry workforce, which should include business analysts, process owners, product owners, and really anybody who shows aptitude for manipulating data, should be able to access the analytical data model and produce their own information and insights, with supporting materials produced by the analysts. This has the effect of really aggressively scaling data consumption. Analysts are no longer fighting to maintain hundreds of reports — they’re simply providing the root information in a way that removes most of the technical sorcery, leaving a dataset behind with appropriate documentation to ensure the context is understood by users. Governance is very important in this scenario, so don’t leave insufficient information, or you’ll be in danger of having individuals misinterpreting information en masse! It is also important that the business focuses training and development for this segment, since it will help massively improve the quality of the insight drawn out by those exploring the raw data.
- Reporting Layer — Data-Averse Workforce While exploratory reporting will serve many individuals, particularly in data-rich organisations, standard reporting is still a necessity for those who are simply not interested in manipulating the data for themselves. These reports can follow existing business processes for requesting reports and analysts should be able to produce them. This should also be the landing spot for high-usage reports that are utilised widely through the business for the most important informational metrics and touchpoints.
- Dashboard Layer — The Executive’s Temp-Check Finally, for executives or directors, where detail is less necessary, dashboards should exist to collate important information in a way that ensures it can be consumed in the least time possible. Busy executives are not going to dive into the weeds and solve the problems themselves, they simply need the information required to guide resources. In this way, we can provide clear dashboards with the organisational metrics that matter most.
Now that we’ve defined these levels and we know the deliverable outputs from the data teams, it’s important to ensure we can get to those outputs. In many situations, data teams can be inefficient and wasteful in execution, and a huge win in the battle to build and sustain a data-driven culture is accountability. So, stay tuned for article two, where I’ll look into some (relatively unpopular) approaches to ensuring delivery from the data teams.