
F1 Track Analyses
20 March 2024

Setting Goals and Digging Backwards
I’m a huge fan of F1 and have been meaning to dig into the available data for as long as I can. Track data is freely available online, along with the spectacular ‘Ergast’ database. An exceptional resource, updated race after race, with loads of the available data from the weekend - including every laptime, from every race, since 1996. For a data-obsessed F1 fan - this is the mother load.
Now, before I start here, my plan is to produce a series of analyses that I can begin to use predictively as the year continues and measure impacts. I don’t have any insider data or knowledge - I just have access to watch the sessions and access to the data sources that I’ll link in the posts. Things like surface quality, track temperature and other vital metrics are just not something I have access to, and so the outputs have to be tempered with that. That being said, I’m super interested to see what nuances exist in the available data.
The objectives of this first piece are clear. At the outset, I simply want to analyse circuits to determine how they’re different in terms of directional change and associated metrics. It’d also be great to get a sense of the circuits and how they compare visually.
The Circuits and Definitions
Circuits
F1 has a litany of circuits, and for now, for the purposes of this, I’ll be analysing those that are quite simple to absorb via the data. Some, like Monte Carlo, have awkward indexing - and while it can be resolved, I just won’t be doing it right now (although I will post updates as and when).
The full list of 20 circuits so far is:
- Abu Dhabi
- Austin
- Baku
- Barcelona
- Budapest
- Jeddah
- Las Vegas
- Lusail
- Melbourne
- Mexico City
- Montreal
- Monza
- Sakhir
- Sao Paulo
- Silverstone
- Singapore
- Spa Francorchamps
- Spielberg
- Suzuka
- Zandvoort
Definitions
Corners and Straights
One thing I have begun doing, is defining my own corners. Around 75% of the way through this task, I realised that I probably shouldn’t be doing it. The information is freely available, but I felt like the available data was quite classical (ie, the tracks themselves have defined the corners, despite some barely being corners at all) and failed to properly classify things. It’s notable that some ‘straights’ are not straight, and some (many) corners don’t involve any braking. I think they might all be better characterised as sections. Some sections are perfectly straight and some involve an angular delta (ie, a car enters and leaves in different directions). Also, sections are also definitely a function of the previous and following section. A 45 degree corner at full throttle after 10s of pure acceleration is very different to a 45 degree corner immediately following a 160 degree bend. I have absolutely no concept of how these things differ in practice right now, nor will I likely be able to engineer an understanding, but analysing these track nuances will be key to discovering any nuanced differences in car performance over the year.
Entry and Exit
Additionally, knowing what comes before and after is important. For example, the final pair of corners at Spa are at similar angles, but they’re different in how they’re handled. One involves intense braking from high speed and a limited exit (since it goes straight into the next corner). The latter involves a very slow entry with a full power exit. Despite the angle being the same, it felt important to model the nuance - so the previous segment type and length have been included (and by inference, the following segment type and length). Notably, some additional code was necessary for the final straight - since it doesn’t naturally follow that the first straight and the last straight are the same thing.
Numeric Outputs
Corners
The beginnings of corner profiling are shown in the table below. I have limited these to the Sakhir circuit for simplicity of reading. Some short definitions:
- Segment Code Literally just a codified way to identify the segment type and its order in the group.
- Previous Segment Code Uses the segment code structure to articulate the previous segment.
- Turn Angle The cartesian angle of the corner.
- Corner Coefficient A working variable used to attempt to convey the intensity of a corner. Notably, I suspect this is not a simple continuous variable - but for now it’ll serve as an illustrative figure.
Straights
And similarly, the basic straight profiles are shown here. In addition to the items above, there’s a definition:
- Straight Vector Delta The change in direction over the course of the straight. Notably, this is a sum value, so S-type curves in the straight are accounted for (ie, the directional change is unsigned).
Track Overview
Now, looking at the track at Sakhir, I’ve attempted (in a very blunt way for now) to envisage the circuit in terms of the intensity of the turns. This is something that I’ll be developing more as I dig - but for now, it’s simply a function of the change in direction and corner length. Corners that are a more extreme directional change and/or shorter will appear as more red.
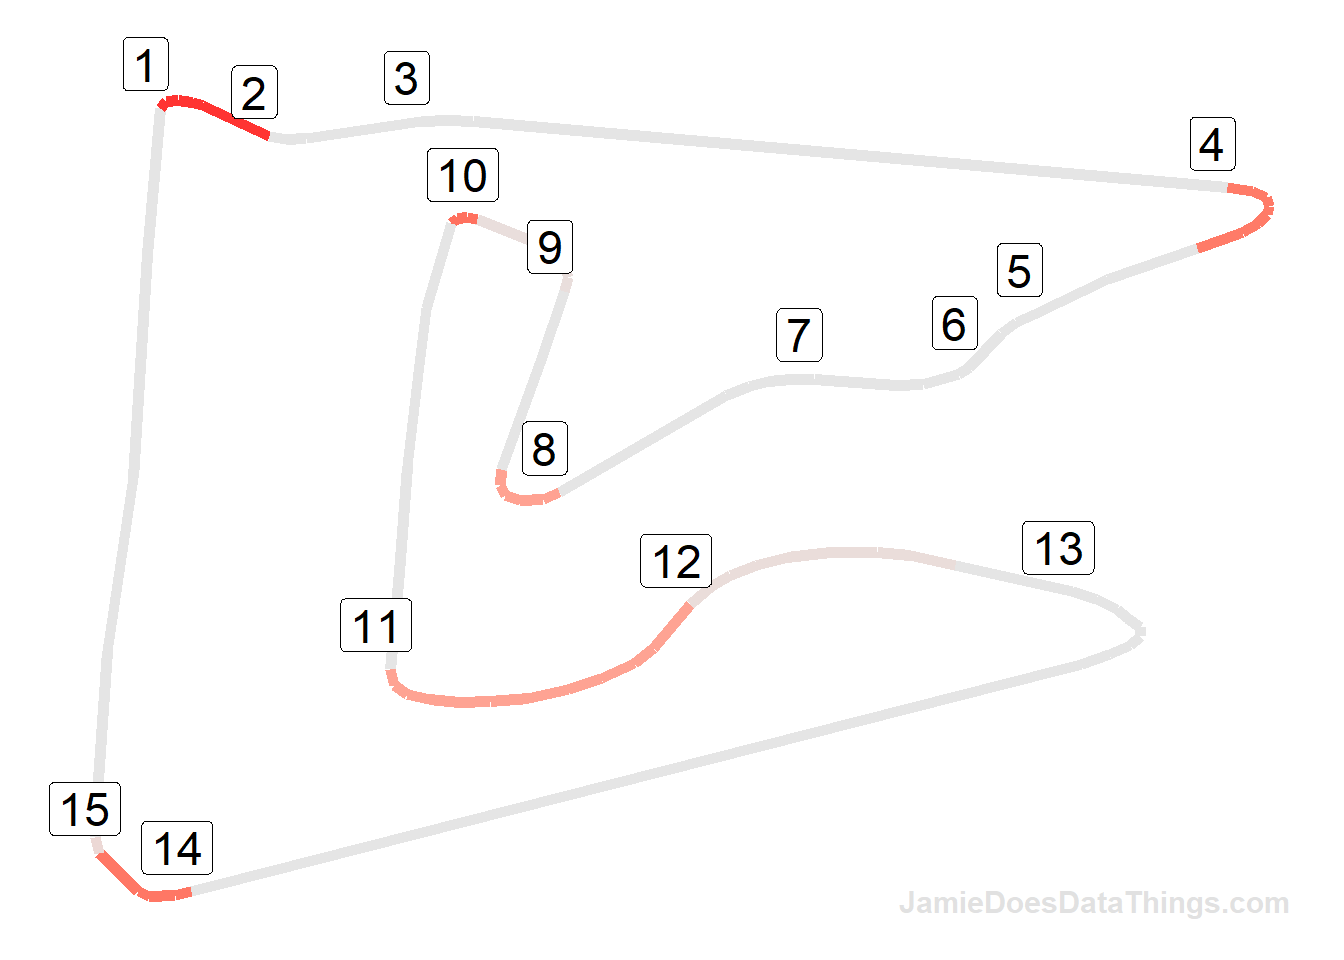
Bahrain International Circuit, Sakhir
Figure 1: Sakhir, with high corner coefficients highlighted
More information on the circuit is available on Wikipedia.
Interestingly, looking at the image, I can aready see some areas where I think the analysis might be weak. For example, at turn 12, a notoriously fast uphill right-hander, the intensity is not as extreme as some other corners - despite this arguably being the fastest the car will be going under significant turning. I’d expect, perhaps naively, for the tyres to experience really high wear going through this corner; certainly higher than at turn 10. The same thing likely applies at turns 5, 6 and 7. It’ll perhaps be interesting to come back to this concept further down the line: the differences between a hard braking style corner and/or fast flowing fluid corners.
None the less, I’ve attempted to re-envision the track, prioritising the faster and more wear-intensive corners:
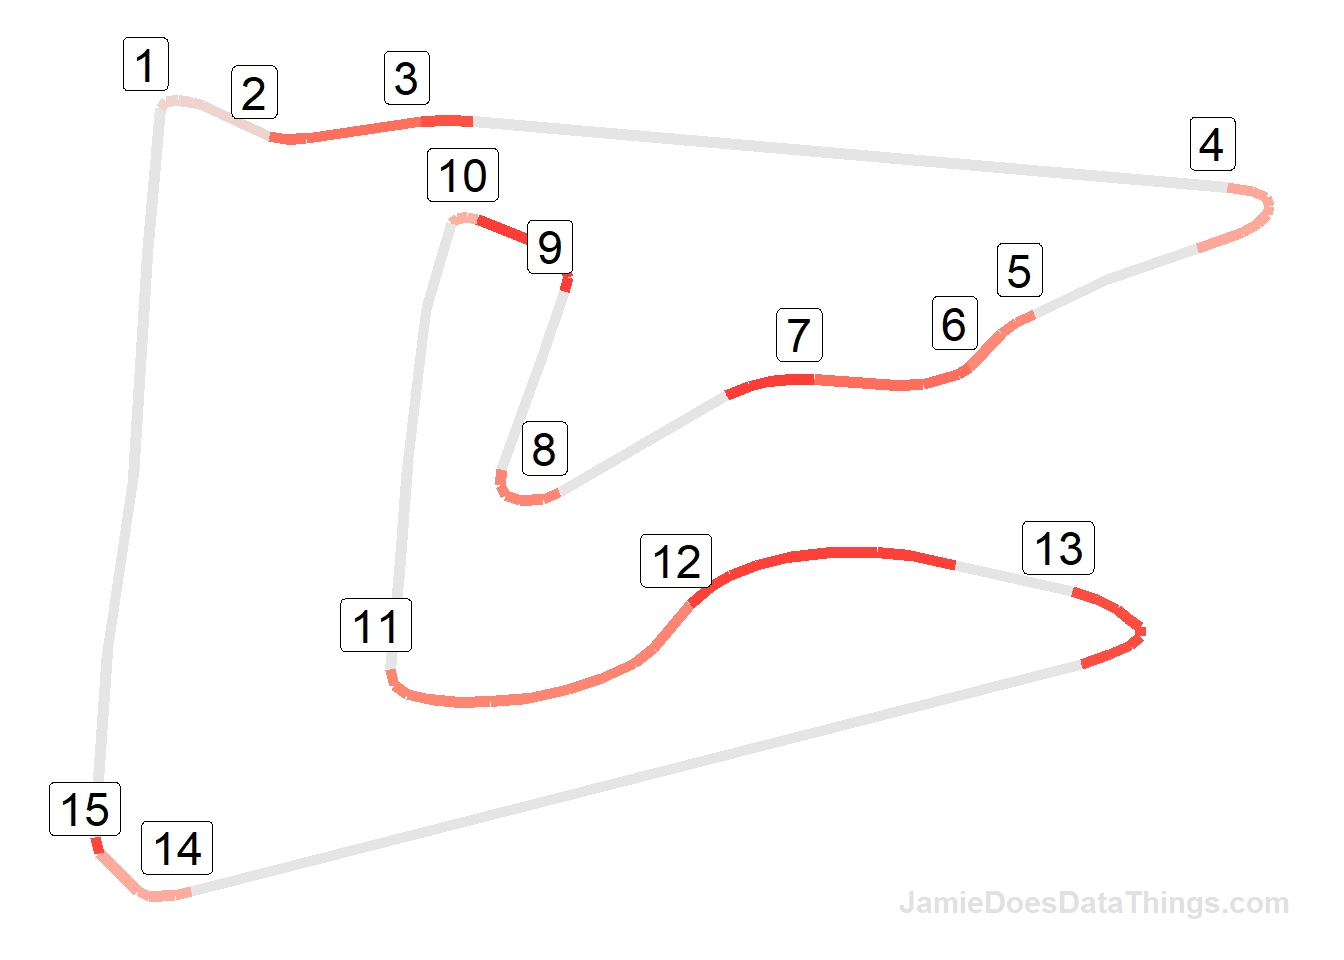
Figure 2: Sakhir, with fast, sweeping corner coefficients highlighted
Extending Across All Tracks
So, with a view to analysing car performance across the various tracks, I’ll now build out a wider visual and dataset of all tracks using the same approach above. The idea will be to take these datasets into a race weekend and review differing car performance on differing tyres. With this in place, and considering the already completed Bahrain, Saudi Arabia, Australia and Japanese Grand Prix, I should have enough to get stuck into some wider datasets around tyre performance and other bits and pieces.
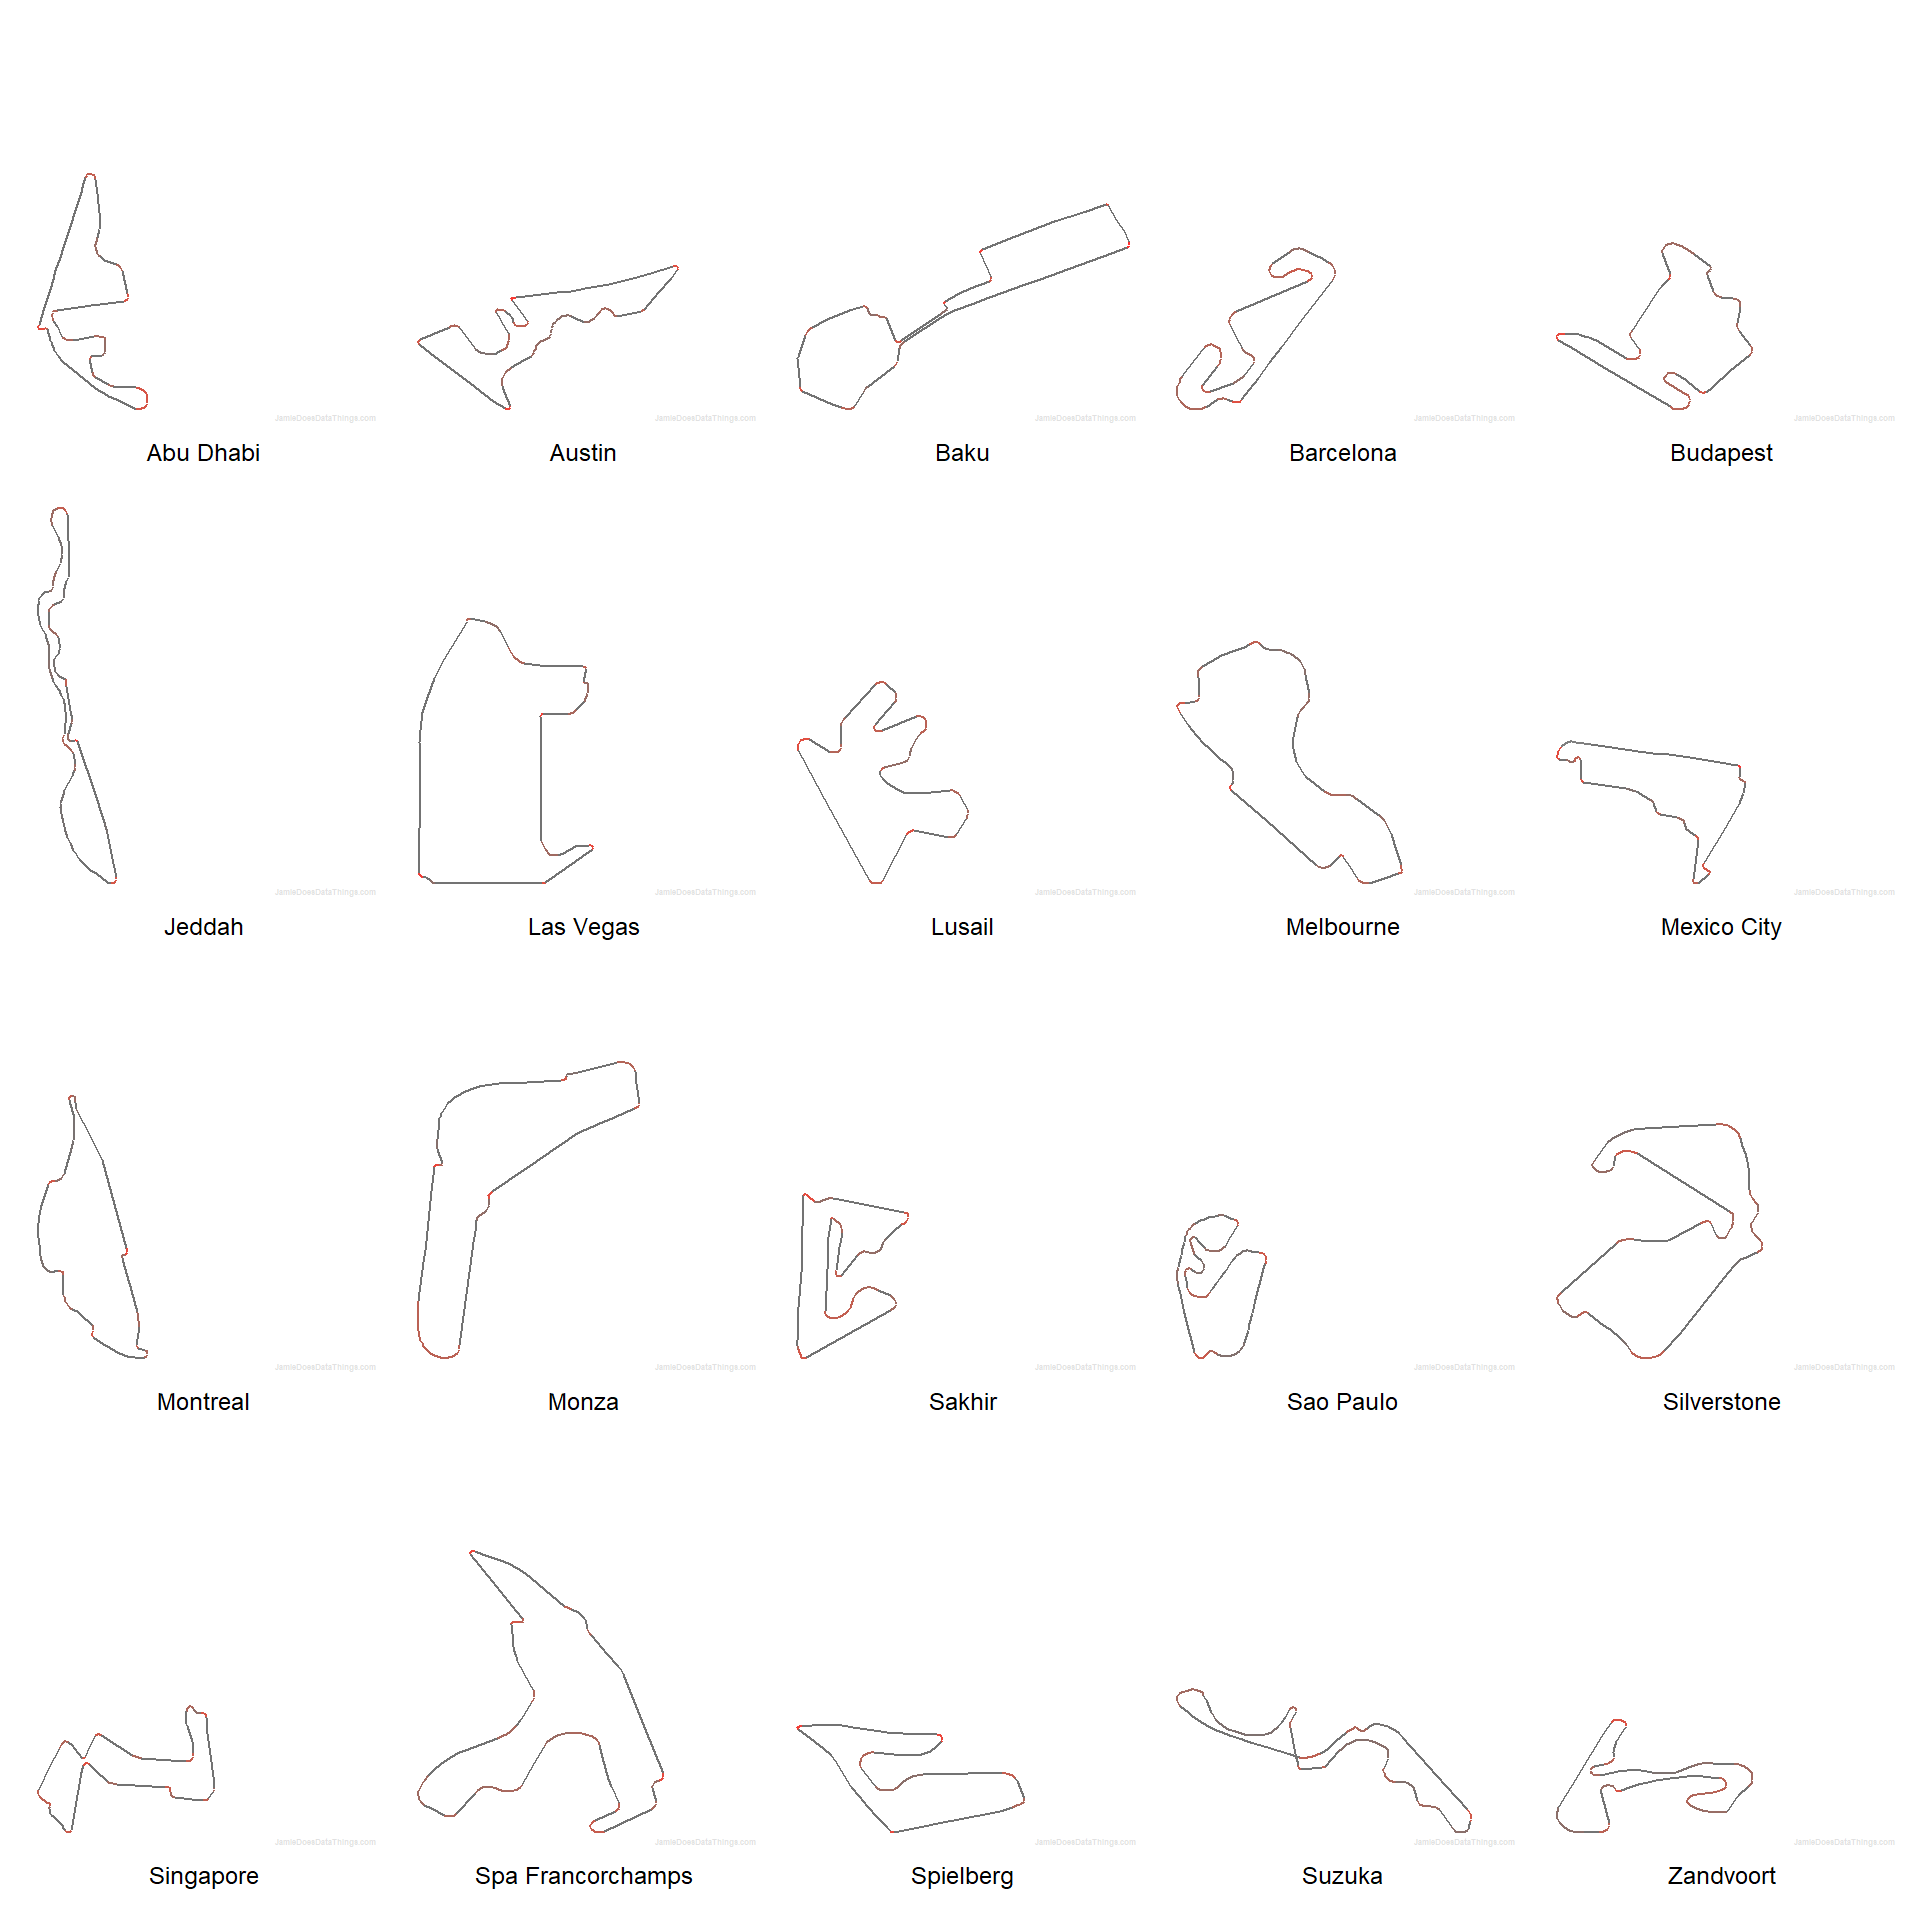
Figure 3: All tracks, to scale
In addition, with the first four races as they are, I also already have the track metrics - so it should be the case that I can continue to develop models of how different cars and tyres perform (generally at least) in the short term. When thinking about this, it’s worth noting that tyres are not simply ‘soft’, ‘medium’ and ‘hard’, but are actually five unique compounds, of which three are chosen for a race and branded as mentioned before. These tyres range from C1 to C5 classification, so worth noting the specific tyre selection, rather than the simple-terms item.
Track Comparison
Anecdotally, there does appear to be a number of traditionally high-wear tracks with high peaks right around the average. This would seem to make sense, since those high-speed, high-angle turns are likely to require good downforce and drive the car into the ground. Examples here might be Silverstone, Barcelona and Budapest all seem to fit the bill.
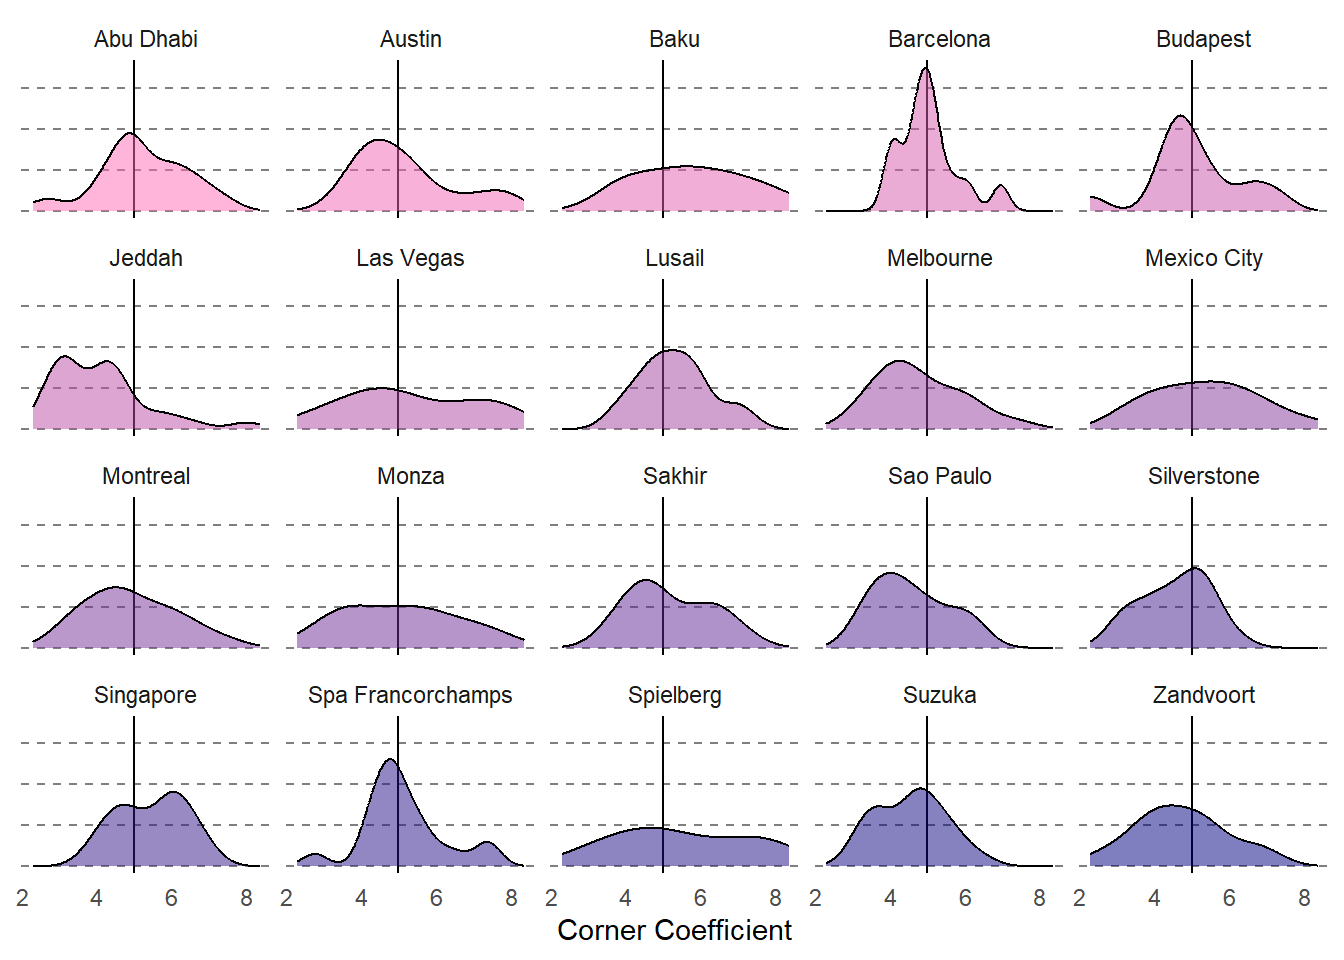
Figure 4: Track cornering coefficient distributions
Extending this, I was just curious to check on a relationship between percentage of the track being straight and corner coefficient. Now, considering corner coefficient is directly related to corner length, it would seem sensible that tracks with lots of straight have lower corner length, and therefore the relationship would be a no brainer - but it is encouraging to see this expectation validated. It also conjures a notion of completing some feature engineering at a later stage and playing with clustering to group the tracks in a more analytically rigorous way.
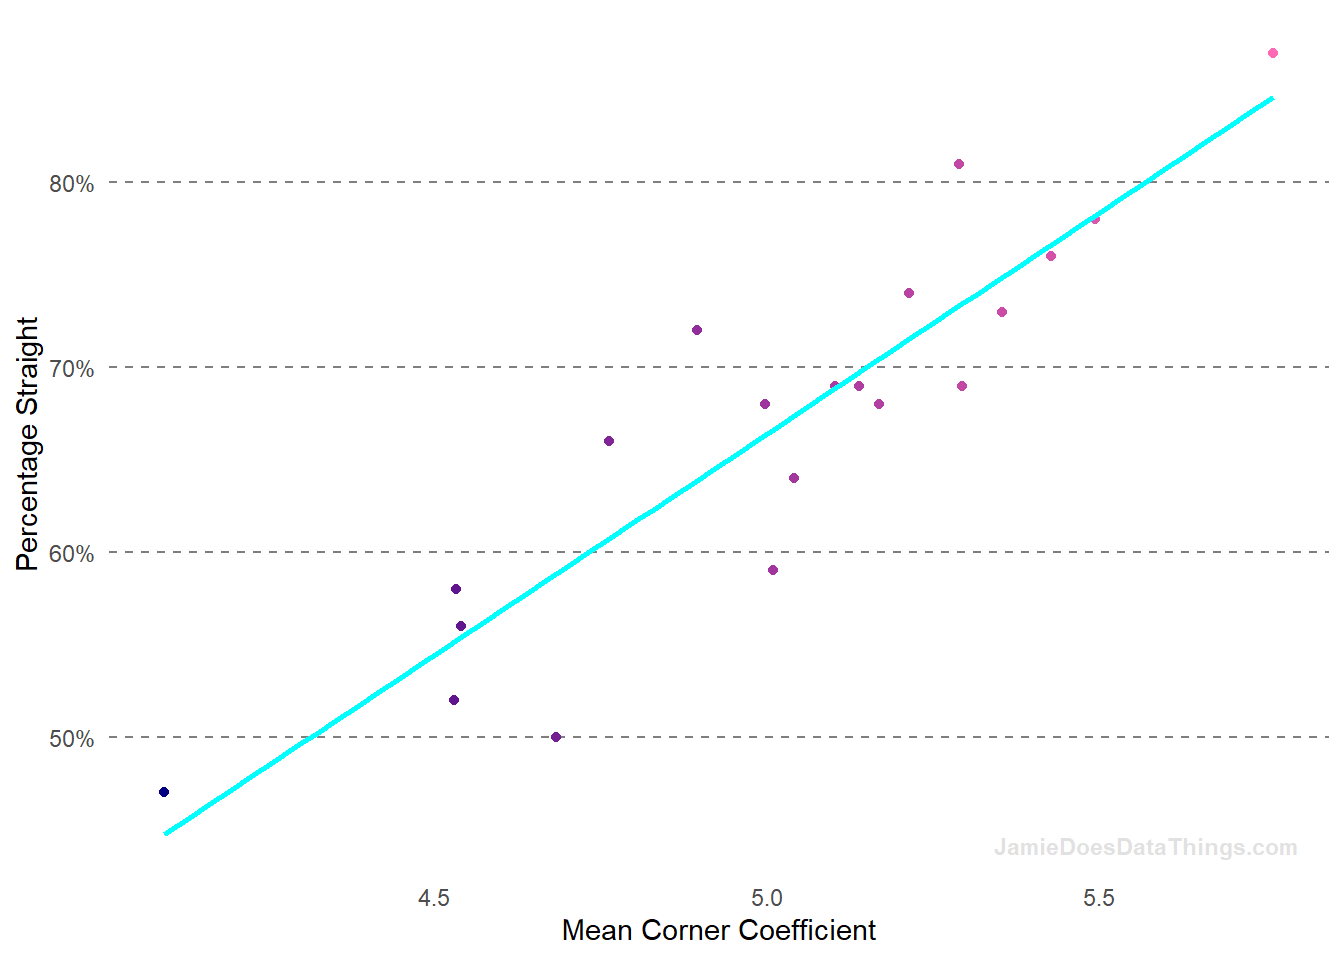
Figure 5: Relationship between percentage straight and cornering coefficient
Final Thoughts
It’s really interesting (in the geekiest possible way) to see this stuff ‘on paper’ so to speak, but I guess the question here is ‘so what?’ Well, right now, honestly nothing. I simply wanted to break some things down since I had track information as a way of providing additional information for future analyses. I’m already most of the way through an analysis of Bahrain and I expect to tie that together with analysis of the subsequent three races and this information, to attempt to start understanding performance in a more detailed way. I’m conscious none of this is for the typical fan, but hopefully for the data and detail guys it’s been an interesting review of the F1 calendar from a circuit perspective.
Additional Considerations and Future Work
- Collect tyre compound dataset
- Attempt to grade tracks on surface quality
- Determine source for bringing in circuit weather data - if available
- Feature engineering and clustering for tracks